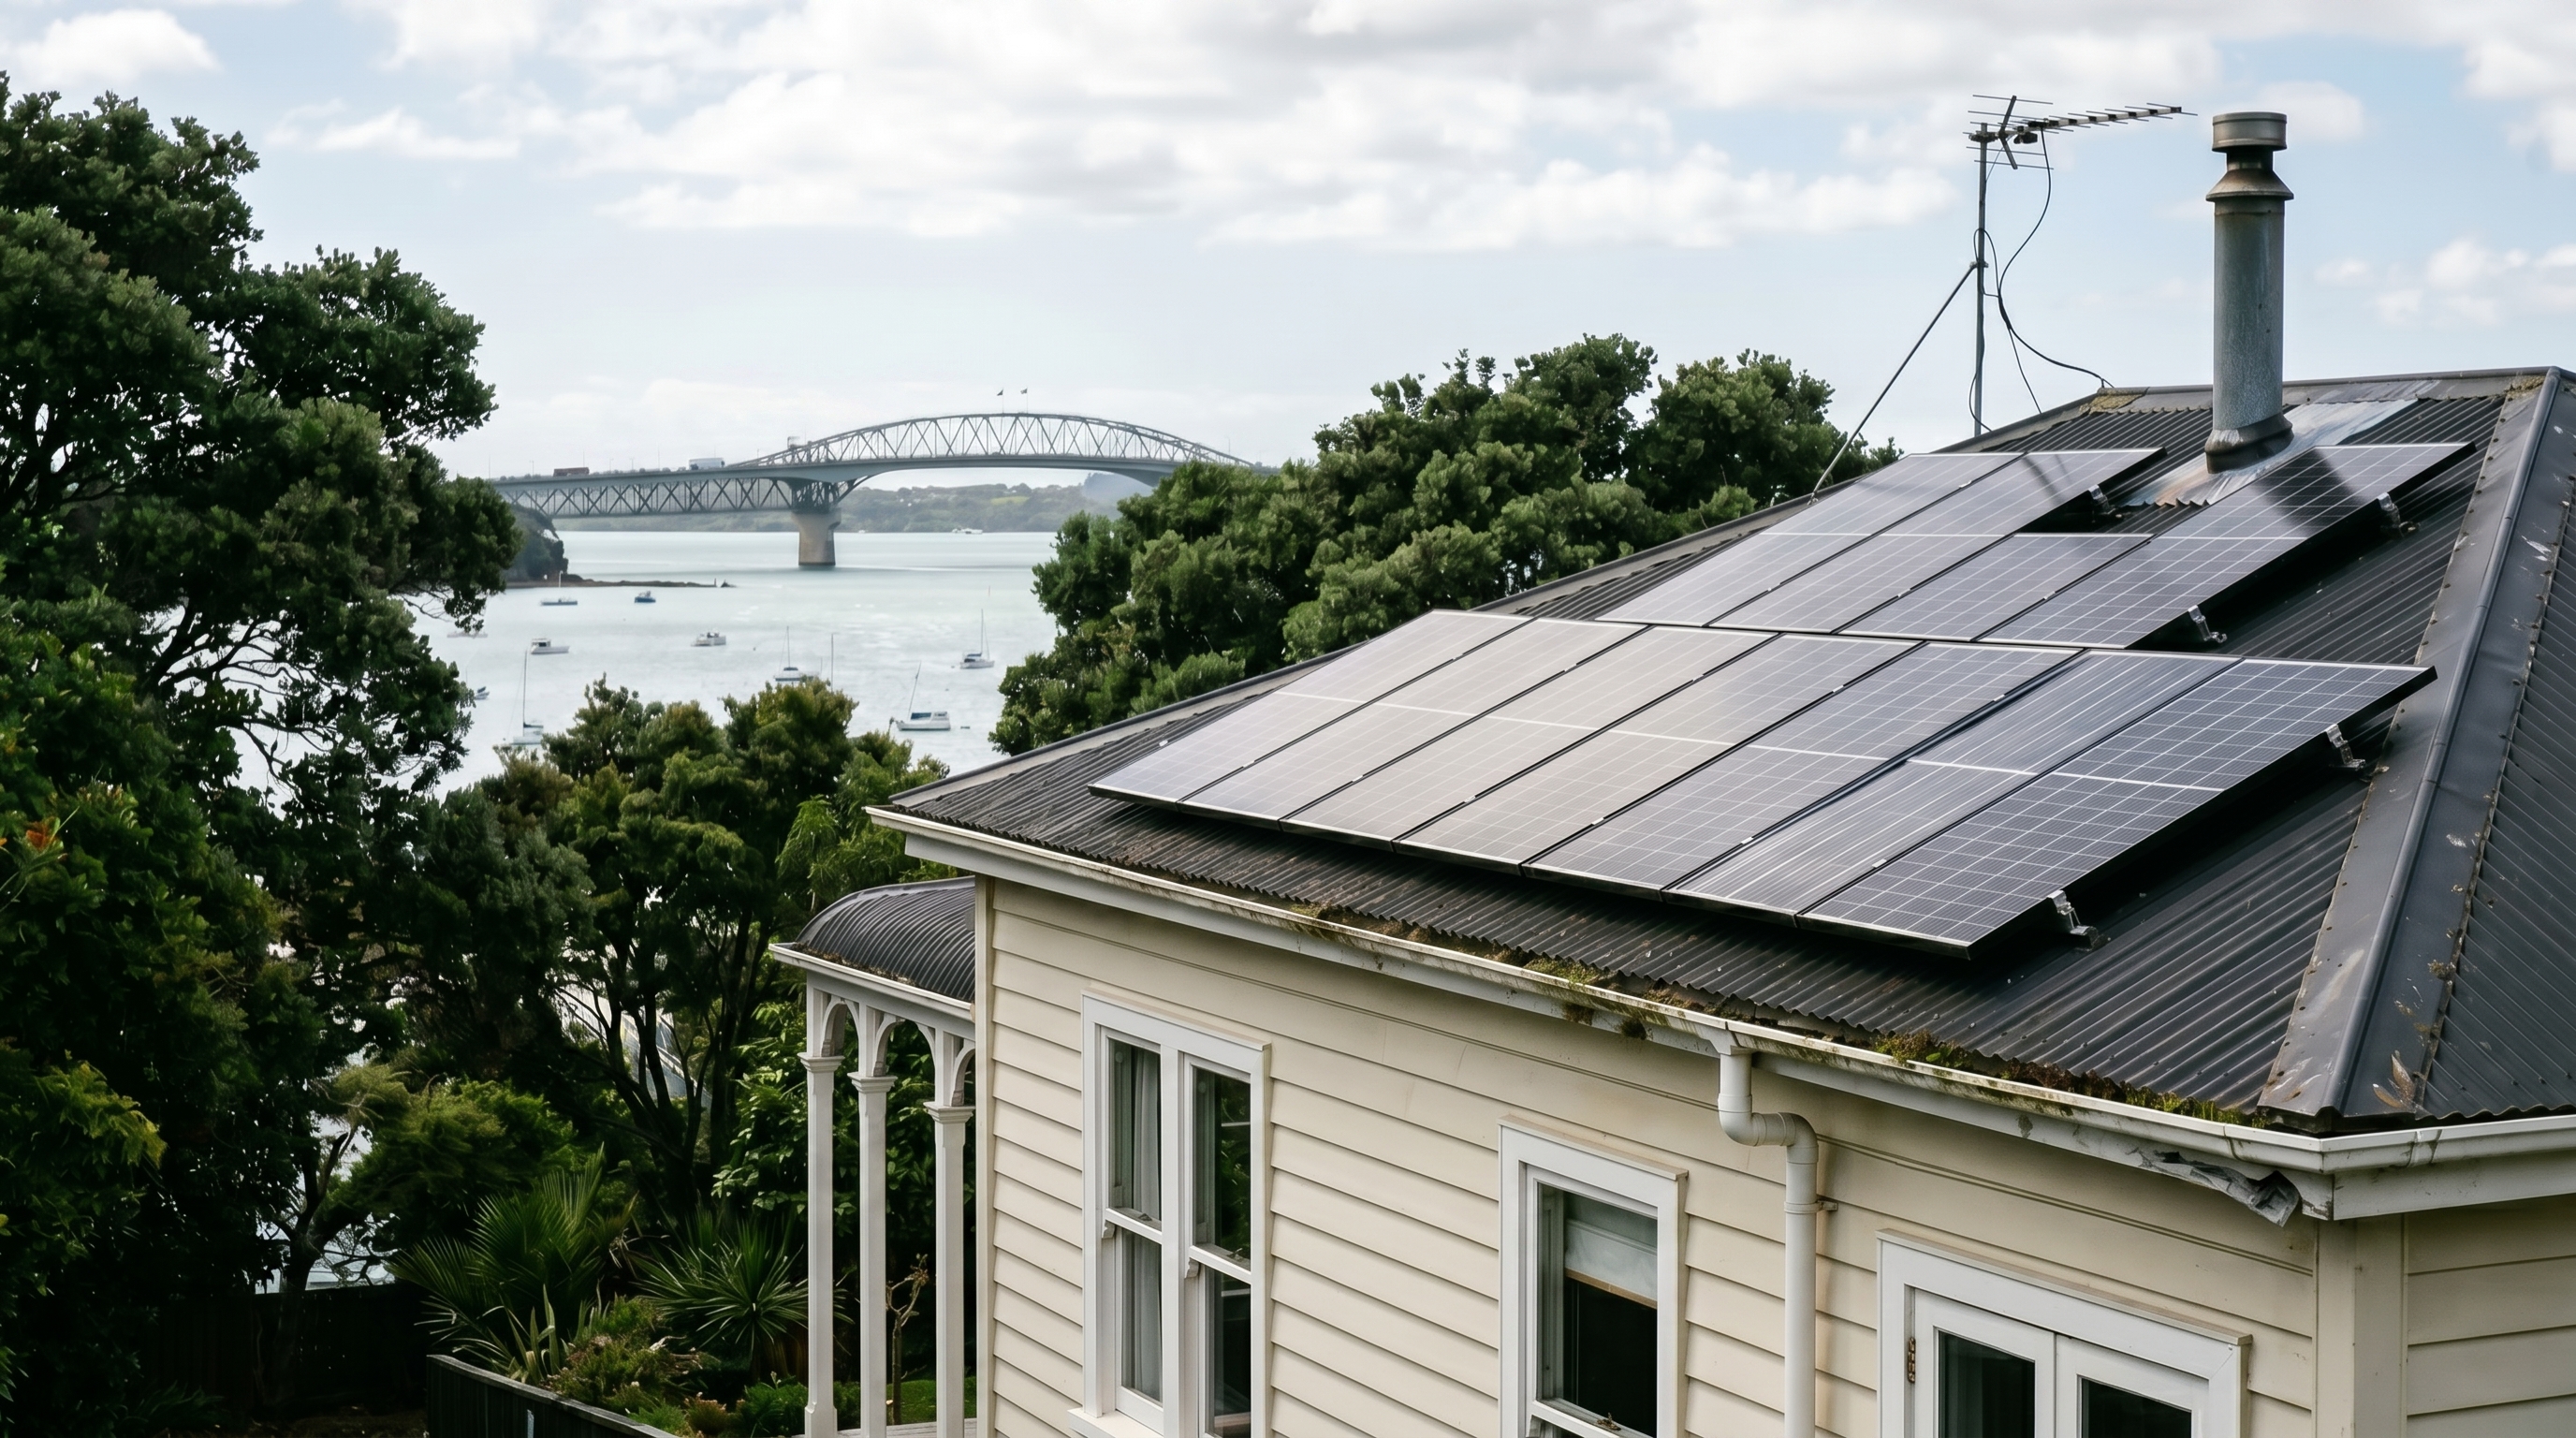
Solar in Northland: Complete Guide for 2026
NZ's highest power rates, 10kW export limits, and the country's fastest solar payback at 5.7 years. What Northland homeowners need to know.

Peak Sun
Hours
4.3
hrs/day
Avg Power
Rate
36.4
c/kWh
Annual
Sunshine
2,050
hrs/year
Grid Connection
Northpower / Top Energy
Residential export capped at 10 kW without pre-approval
Northland has New Zealand's highest residential electricity rates at 36.4c/kWh, well above the national average, and that translates directly to the country's fastest solar payback periods. A typical 6.6kW system in Northland generates around 9,430 kWh per year and saves around $2,400 annually, putting payback at just 5.7 years. Combined with Northpower and Top Energy's generous 10kW residential export limits (up from 5kW in 2025), Northland is currently one of NZ's most economically attractive solar markets. The region's sub-tropical climate also means consistent year-round solar generation, with mild winters that don't slash output the way Otago and Wellington winters do. Whether you're in Whangarei, Kerikeri, Kaitaia, or out on the Tutukaka Coast, this guide covers Northland solar production data, the EDB pre-approval rules, and Solar Scout-vetted installers serving the region.
Want a personalised estimate for your Northland home? Answer a few quick questions and get matched with Solar Scout-vetted installers.
power bill?
How much solar will you generate in Northland?
With 4.3 peak sun hours per day and a production factor of 1.08relative to the Auckland baseline, here's what a typical roof-mounted system generates in Northland per year.
Savings figures assume a typical 70% self-consumption rate and use the local electricity rate of 36.4c/kWh. Your actual savings depend on roof orientation, shading, and your daily usage pattern.
For the national picture, see how Northland stacks up against the other 15 NZ regions on annual generation per kW installed.
Electricity and buy-back rates
Northland households pay an average of 36.4c per kWh for grid power (MBIE QSDEP, latest survey). Every kilowatt-hour you self-consume from your panels saves you that full retail rate. Excess generation flows back to the grid, and your retailer pays you a buy-back rate. The top retailers serving the region:
Self-consumption is the bigger saving: every kWh you use yourself is worth 2 to 3 times more than every kWh you export. For the full national retailer comparison, see our buy-back rates guide.
Northpower / Top Energy export rules
Northpower (most of Whangarei and the Far North) and Top Energy (Bay of Islands and Far North fringe) both increased their residential export limits to 10kW in 2025, up from 5kW. This was a major shift for Northland solar economics. Most family homes in the region can now run 7.5 to 10kW systems without any DG approval delay. Coastal corrosion is the main install consideration north of Whangarei: marine-grade mounting hardware and tier-one panels are worth the small premium.
Typical system economics
Below is what a typical 6.6kW system looks like in Northland from a financial perspective. Real numbers will vary with installer, brand, and roof complexity. For the full national pricing context, our NZ solar installed-cost guide shows what 6.6kW jobs typically include and how to spot a fair quote.
Estimated for a typical 6.6kW system in Northland
What you can expect
System size
6.6kW
Installed cost
$13,800
Annual generation
9,430 kWh
Annual savings
$2,410
Payback
5.7 yrs
Estimates based on the regional production factor, average local electricity rate, and a typical 70% self-consumption profile. Your actual savings will vary with your roof, usage pattern, and retailer.
Sunshine by month in Northland
Solar generation tracks closely with sunshine hours. Here's how Northland's monthly sunshine hours look across the year (NIWA data).
Sunshine hours by month
How Northland compares month-to-month
Total: 2,050 sunshine hours per year. Range: 115 (winter low) to 240 (summer peak) hours. Source: NIWA.
Choosing the right installer matters more than choosing a panel brand. Workmanship quality, paperwork handling, and how a company services warranty claims drive most of the long-term experience. Our guide to choosing a solar installer in NZ covers SEANZ membership, the questions to ask, and the red flags to avoid.
Local installers
Solar Scout-vetted solar installers serving Northland
Every installer in the Solar Scout network is independently vetted. We connect you with the ones operating in your area, never the highest bidder.
- SEANZ Member: Sustainable Energy Association of New Zealand
- EWRB Registered: Licensed electrical workers, audited annually
- Master Electricians: National accreditation body for installation quality
- Fully Insured: Public liability cover for every job
Northland solar FAQs
Why is Northland NZ's fastest payback for solar?
Three factors stack: highest electricity rates in NZ at 36.4c/kWh, sub-tropical climate with consistent sun, and 10kW export limits. A typical 6.6kW system saves $2,400+ annually, pushing payback under 6 years.
How does the 10kW export upgrade affect Northland sizing?
It opened the door for 7.5 to 10kW systems on family homes without DG delays. Previously most Northland systems were sized at 5 to 6.6kW to fit under the export cap. Now you can produce more aggressively.
Coastal corrosion: what to ask installers about?
Anything within 2km of the coast should use marine-grade aluminium mounting, stainless fasteners, and UV-rated conduit. Ask specifically about salt-air-rated components and tier-one panels with strong frame warranties.
How long does install take in Whangarei?
Typical 4 to 6 weeks. Northpower and Top Energy DG approval is generally 2 to 3 weeks. Far North installs sometimes add a few days for travel logistics.
Sub-tropical winters: how does Northland output stay high?
Mild winters and longer daylight hours than further south mean June and July output is typically 50% of December peak (vs 30% in Otago). That smoother seasonal profile boosts annual yield.
Written by Ben Wallis
Ben has worked as a licenced electrician in New Zealand for over six years, from residential rooftop systems to large industrial projects. He writes Solar Scout's guides based on real experience in the field, so Kiwi homeowners hear what installers actually think, not what salespeople say.